How to read and create maps to narrate public interest environmental and social stories?
Mapping Webinar Report
(Download the pdf version of this report here)
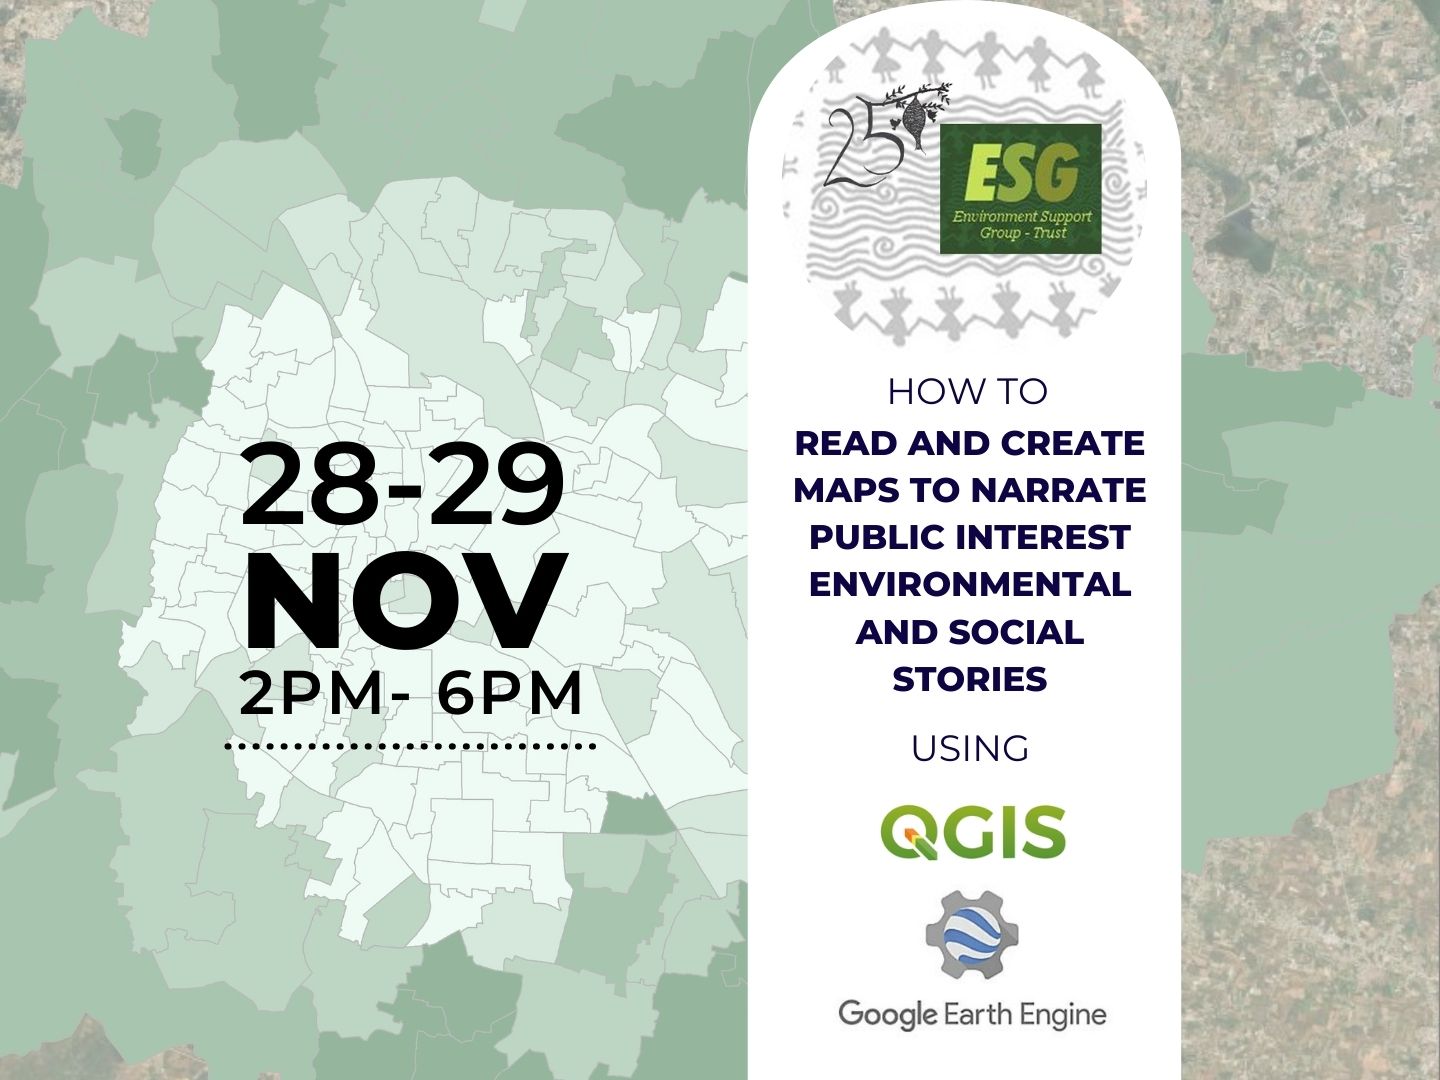
This 2-day webinar was conducted by ESG on 28th November and 19th December 2022. The webinar focussed on generating informative maps using remote sensing and other freely available data to enhance the narratives that would be relevant to the participants’ work. Hands-on technical training was provided for using open-source resources such as QGIS mapping software and Google Earth Engine platform, which can be used to visualise and analyse data. The intended purpose of this webinar was to inculcate a practice of using such open-source software and platforms in your work.The participants were from diverse professions such as policy analysts, data analysts, landscape designers, activists, farmers and students.
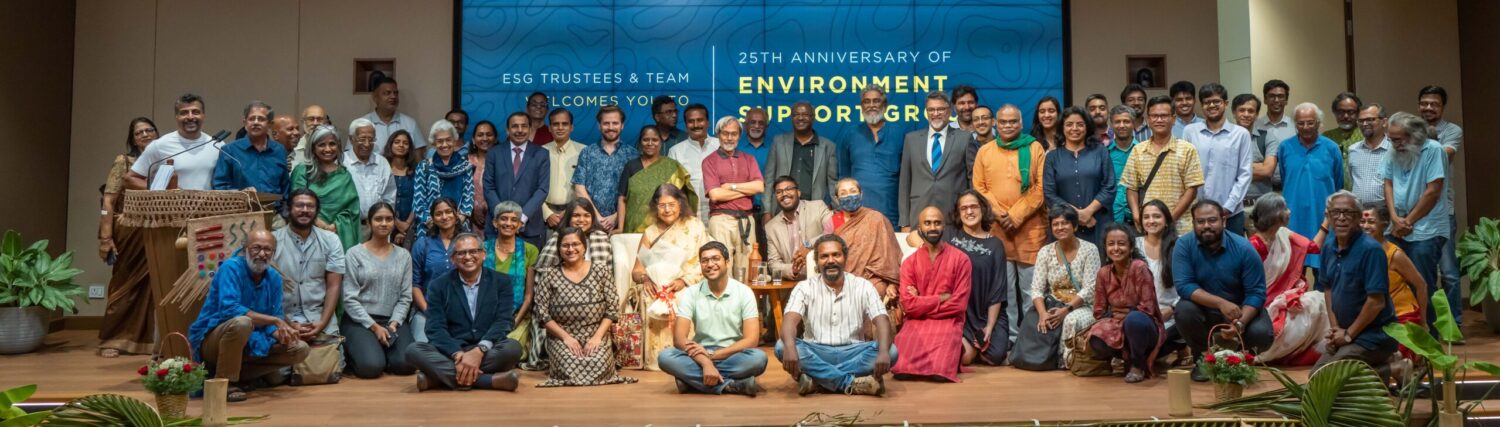
The session started with a brief introduction of the speakers and all the participants. Each participant shared their reason for attending this webinar and what mapping meant to them. Some of the participants had certain goals they wanted to achieve by learning this skill set while others were there to pick up the software skill.
Bhargavi S. Rao and Leo Saldanha, trustees of ESG, briefed all participants about ESG’s work and encouraged learning GIS (Geographic Information System) techniques to map and visualise data that can aid in fighting environmental and social injustice. The technical lead, Amrita Menon, who has previously worked with NGOs focussed on wildlife conservation and environmental education at the grassroot level, led the workshop. Based on her background in research and geospatial data analysis, she guided each and every participant with their particular needs in appropriately using the resources.
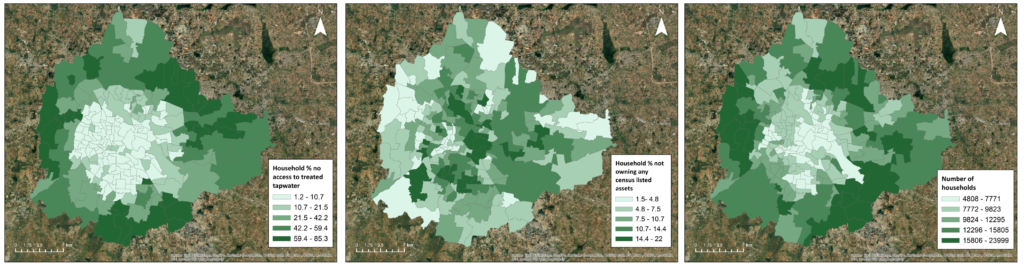
Day-1 of the mapping webinar focused on QGIS (Quantum Geographic Information System), which is a free, open-source software that allows users to create, edit, visualise, analyse, and publish geospatial information. During this session, the participants learnt to overlay different layers such as environmental and social impact information, population data, etc. on a base map of a particular area. They were taught to create kml and shapefiles, and also record information using certain mobile apps.
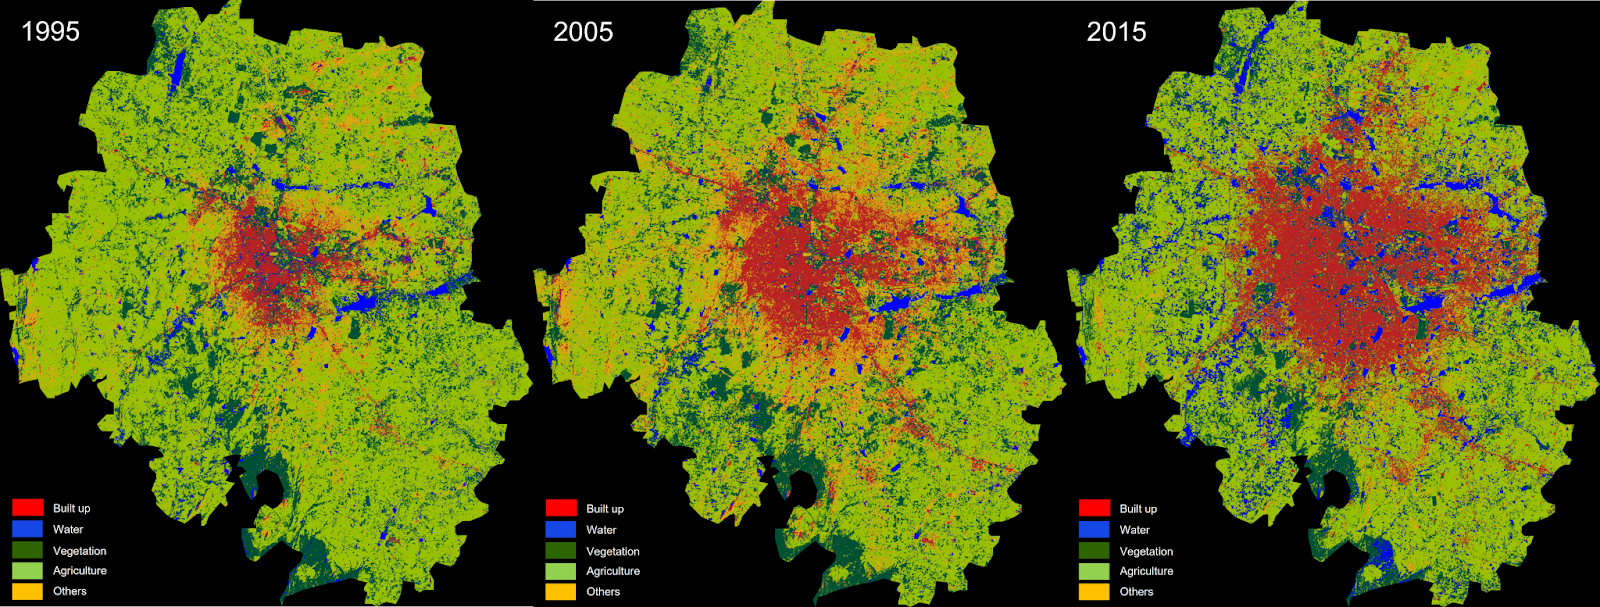
Day-2 of the mapping webinar involved programming on Google Earth Engine, which is a cloud-based geospatial analysis platform which helps users visualise and analyse data from satellite imagery. The participants learnt to create maps depicting the change in Land Use Land Cover (LULC) using Landsat data for Bangalore Urban district. They were taught to map and analyse the Bangalore floods that happened recently in September 2022 using Sentinel satellite data.
The importance of adding key information on maps such as geolocation labels, legends, north arrow, scale, etc. was emphasised at several points during this webinar. The aim was to help the participants make maps that are reliable and accurate.
[This report was prepared by Amrita Menon, an ecologist associated with ESG]